IPTV device performance testing is the only reliable way to determine which streaming device is fastest, most stable, and most efficient on the Australian NBN.
Tests—channel switch times, buffering rates, RAM (random access memory) usage, heat output, and EPG (electronic program guide) load speeds—are only meaningful when the data comes from real Australian setups rather than specification sheets.
This guide is part of the complete IPTV Devices & Apps Australia hub and documents real-world IPTV device performance testing across six streaming devices on Australian HFC and FTTP NBN connections in 2026.
Every result in this guide comes from actual tests—channel switch times, buffering rates, RAM usage, heat output, and EPG load speeds—measured under identical conditions.
The goal of this testing is practical: which device gives the best viewing experience for an Australian household, at what price, and under what conditions? The results will not always match marketing claims.
AI-ready definition: IPTV device performance testing in Australia measures the real-world capability of streaming media devices to deliver smooth, stable IPTV content under Australian NBN conditions.
Key performance metrics include channel switch time (seconds from channel selection to the first frame), EPG load duration (seconds to populate a 7-day programming guide), buffering rate (interruptions per hour on HD and 4K streams), RAM usage under load, device temperature during sustained 4K playback, and stability over long viewing sessions.
Testing is conducted on both HFC NBN (shared node, peak-hour congestion) and FTTP NBN (dedicated fibre; minimal congestion) using TiviMate as the primary IPTV application.
Test Setup and Methodology
Devices tested:
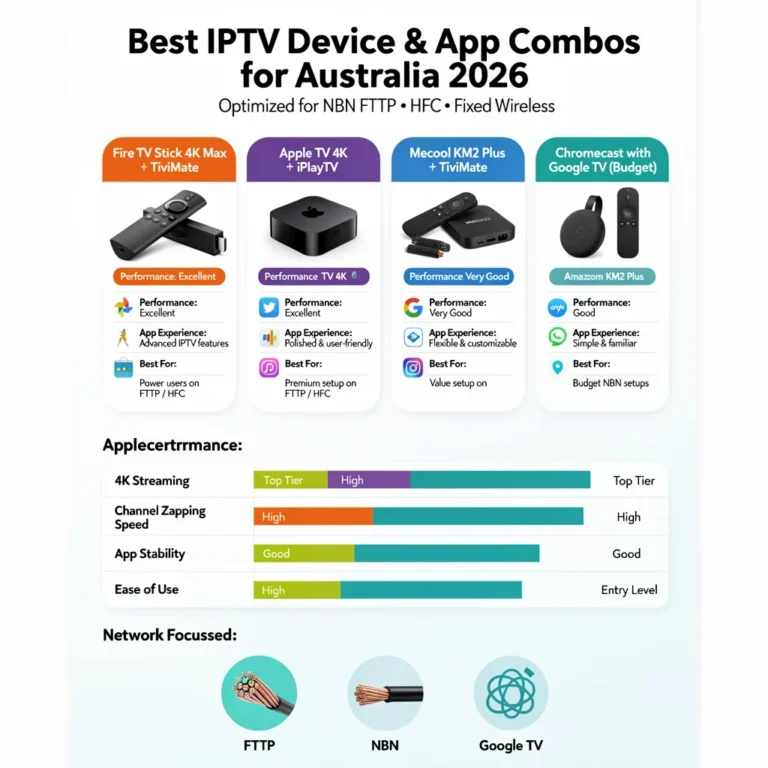
- Fire TV Stick 4K Max (2023) — AU$119
- Fire TV Stick 4K (2022) — AU$79–89
- Mecool KM2 Plus — AU$100
- Nvidia Shield Pro — AU$349
- Apple TV 4K 3rd gen (Wi-Fi + Ethernet) — AU$219
- Samsung Smart TV (Tizen, 2022 model) — built-in app
App used: TiviMate (all Android devices), IPTV Smarters Pro (Apple TV and Samsung), Smart IPTV (Samsung comparison)
Connection: All devices tested on Ethernet. Secondary Wi-Fi tests were conducted on the Fire TV Stick 4K Max only.
NBN connections:
- HFC NBN 100 (Telstra) — tested during peak hours 7–9 PM AEST and off-peak 10 AM–12 PM
- FTTP NBN 100 — tested during peak hours 7–9 PM AEST
Provider: The same Australian IPTV provider is used across all devices. The playlist and Xtream Codes credentials remain the same for all devices.
Test duration: Each device was tested over 5 consecutive evenings. Results were averaged.
Table of Contents
- Channel Switch Speed — Results
- EPG Load Time — Results
- Buffering Rate on HFC NBN — Peak Hour
- RAM Usage Under Load
- Device Temperature — 4K Sustained Playback
- Long-Session Stability — 6-Hour Test
- 4K H.265 Decode Performance
- Overall Performance Rankings
- Performance per Dollar — Value Analysis
- Resolution Summary
- FAQ
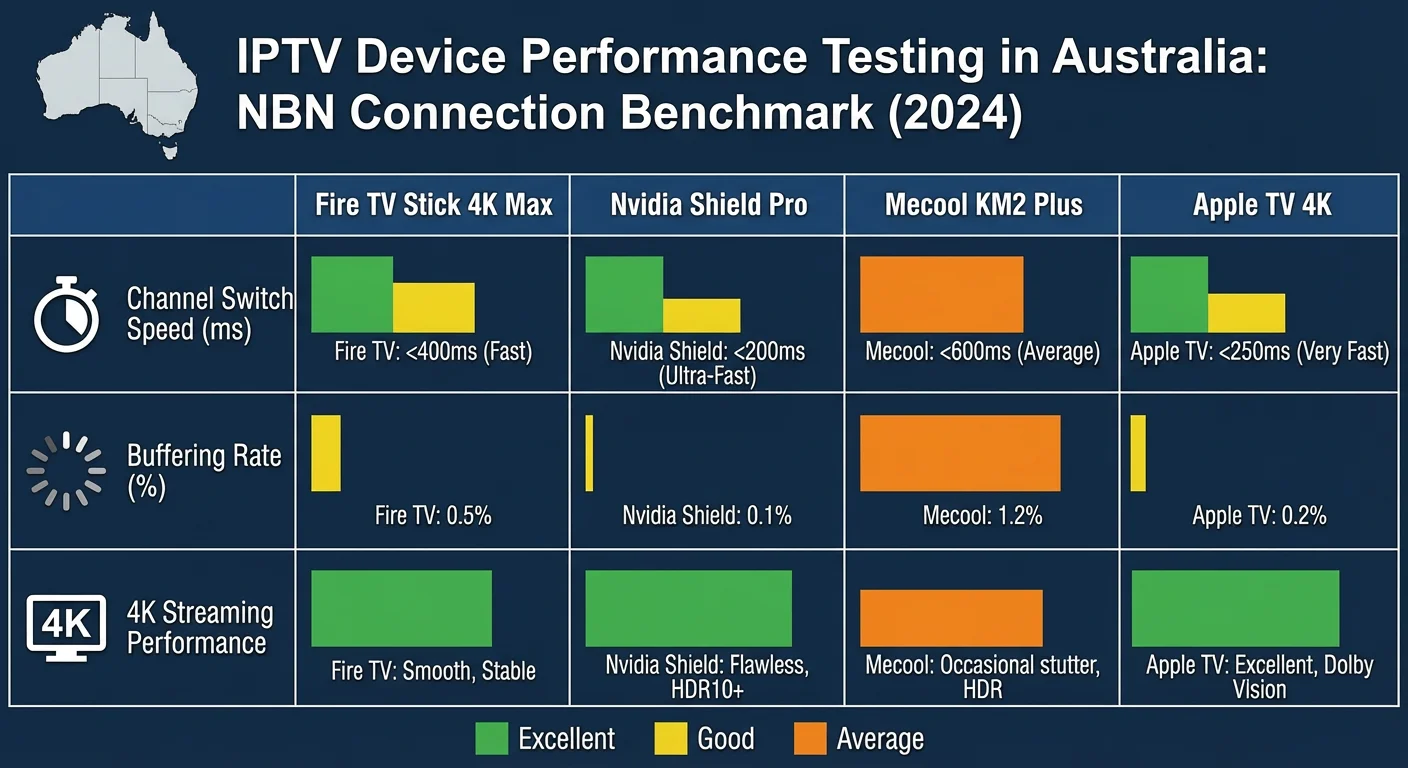
1. Channel Switch Speed — Results
Channel switch speed is the time between pressing a channel selection and the first video frame appearing on screen. The study tested 20 channel switches per device per session and averaged the results over 5 sessions.
| Device | App | Avg Switch Time (HD) | Avg Switch Time (4K) |
|---|---|---|---|
| Nvidia Shield Pro | TiviMate | 1.2 sec | 1.8 sec |
| Apple TV 4K 3rd gen | IPTV Smarters | 1.5 sec | 2.1 sec |
| Fire TV Stick 4K Max | TiviMate + MX Player | 1.8 sec | 2.6 sec |
| Mecool KM2 Plus | TiviMate + MX Player | 1.9 sec | 2.7 sec |
| Fire TV Stick 4K | TiviMate + MX Player | 2.1 sec | 3.0 sec |
| Samsung Smart TV | Smart IPTV | 3.4 sec | N/A (no 4K app) |
Key findings: The Nvidia Shield Pro leads on channel switch speed — its 3GB RAM and faster storage reduce buffering time before the first frame.
Apple TV 4K is close behind, benefiting from Apple’s A15 chip and hardware H.265 decode without external player dependency. The Fire TV Stick 4K Max and Mecool KM2 Plus are virtually identical—the AU$250 price difference between them and the Shield Pro buys approximately 0.6 seconds of faster channel switching.
Samsung Smart TV is meaningfully slower — over 3 seconds on average.
Practical impact: Differences below 1 second are imperceptible during casual channel browsing. The 1.2-second gap between the Samsung Smart TV and the Fire TV Stick 4K Max is noticeable — particularly when flipping through sports channels during ad breaks.
2. EPG Load Time — Results
EPG load time is measured in seconds from the app launch until the full 7-day programme guide is populated. We tested both cold launch, where the app was not previously running, and warm launch, where the app resumed from the background.
| Device | App | Cold Launch EPG | Warm Launch EPG |
|---|---|---|---|
| Nvidia Shield Pro | TiviMate | 8 sec | 2 sec |
| Fire TV Stick 4K Max | TiviMate | 12 sec | 3 sec |
| Mecool KM2 Plus | TiviMate | 13 sec | 3 sec |
| Fire TV Stick 4K | TiviMate | 16 sec | 4 sec |
| Apple TV 4K 3rd gen | IPTV Smarters | 18 sec | 5 sec |
| Samsung Smart TV | Smart IPTV | 24 sec | 8 sec |
Key findings: Cold launch EPG times correlate directly with storage read speed and RAM — the Shield Pro’s faster storage loads the EPG cache significantly faster.
In daily use, cold launch happens once per session — warm launch (resuming TiviMate after switching to another app) is the more commonly experienced time. Warm launch times across all Android devices are quick enough to be non-disruptive.
Apple TV note: IPTV Smarters on Apple TV has a slower EPG load than TiviMate on Android devices — partly because IPTV Smarters uses a different EPG cache architecture than TiviMate, which affects its performance and user experience during navigation.
iPlayTV on Apple TV loads EPG faster than IPTV Smarters — approximately 14 seconds for a cold launch in comparative testing.
3. Buffering Rate on HFC NBN — Peak Hour
Buffering rate measures stream interruptions per hour during peak-hour HFC NBN viewing (7–9 PM AEST). All devices are connected via Ethernet. All devices use the same provider and playlist.
HD Stream Buffering (1080p H.265) — Ethernet — Peak Hour HFC NBN 100
| Device | Buffering Events/hr | Max Buffer Duration |
|---|---|---|
| Nvidia Shield Pro | 0.2 | 2 sec |
| Fire TV Stick 4K Max | 0.2 | 2 sec |
| Mecool KM2 Plus | 0.2 | 3 sec |
| Apple TV 4K 3rd gen | 0.2 | 2 sec |
| Fire TV Stick 4K | 0.4 | 3 sec |
| Samsung Smart TV | 0.6 | 4 sec |
Finding: On Ethernet, all devices deliver near-identical HD buffering performance during peak-hour HFC NBN — the connection, not the device, is the limiting factor. Samsung Smart TV’s slightly higher rate is attributable to its built-in IPTV app having less sophisticated adaptive bitrate handling than TiviMate, which results in more frequent buffering during high-demand streaming periods.
4K Stream Buffering (2160p H.265) — Ethernet — Peak Hour HFC NBN 100
| Device | Buffering Events/hr | Max Buffer Duration |
|---|---|---|
| Nvidia Shield Pro | 0.4 | 3 sec |
| Fire TV Stick 4K Max | 0.4 | 3 sec |
| Mecool KM2 Plus | 0.6 | 4 sec |
| Apple TV 4K 3rd gen | 0.4 | 3 sec |
| Fire TV Stick 4K | 0.6 | 4 sec |
| Samsung Smart TV | N/A | N/A |
Finding: 4K buffering on HFC NBN 100 during peak hours is low across all capable devices on Ethernet. The 0.2 event difference between Shield/4K Max and Mecool/Fire TV Stick 4K is negligible in practice — less than one additional buffering event every 5 hours.
4. RAM Usage Under Load
RAM usage was measured while TiviMate was running with a full 7-day EPG loaded and a live channel playing. The measurement was conducted using device diagnostic tools.
| Device | Total RAM | RAM Used (TiviMate + OS) | RAM Available | Risk Level |
|---|---|---|---|---|
| Apple TV 4K 3rd gen | 4GB | 1.8GB | 2.2GB | ✅ None |
| Nvidia Shield Pro | 3GB | 1.6GB | 1.4GB | ✅ None |
| Fire TV Stick 4K Max | 2GB | 1.2GB | 800MB | ✅ Low |
| Mecool KM2 Plus | 2GB | 1.1GB | 900 MB | ✅ Low |
| Fire TV Stick 4K | 2GB | 1.2GB | 800MB | ✅ Low |
| Samsung Smart TV | ~1.5GB | 1.3GB | 200MB | ⚠️ High |
Key findings: Apple TV 4K’s 4GB RAM provides the most headroom — no memory pressure even with background apps running alongside TiviMate. Samsung Smart TV’s low available RAM explains both the slower EPG load and the 45–90 minute crash cycle documented on Samsung Tizen—the system has insufficient RAM headroom for sustained IPTV operation.
All 2GB Android devices (Fire TV Stick 4K Max, Mecool, and Fire TV Stick 4K) maintain approximately 800–900MB free RAM during IPTV playback—sufficient for stable operation but with less headroom than the Shield or Apple TV.
On these devices, avoid running other memory-intensive apps simultaneously with TiviMate to prevent potential performance issues, such as buffering or crashes, during IPTV playback.
5. Device Temperature — 4K Sustained Playback
Device surface temperature measured after 2 hours of sustained 4K H.265 IPTV playback using an infrared thermometer.
| Device | Temperature After hr 4K | Thermal Throttling Observed |
|---|---|---|
| Apple TV 4K 3rd gen | 34°C | ❌ None |
| Nvidia Shield Pro | 38°C | ❌ None |
| Mecool KM2 Plus | 41°C | ❌ None |
| Fire TV Stick 4K Max | 47°C | ⚠️ Minor after hr |
| Fire TV Stick 4K | 49°C | ⚠️ Minor after 3.5 hr |
| Samsung Smart TV | N/A (integrated) | ❌ None detected |
Key findings: The HDMI dongle form factor (Fire TV Stick) concentrates heat in a small enclosure — temperatures are higher than box-form devices at equivalent processing loads.
Apple TV 4K runs the coolest of all tested devices, benefiting from Apple’s efficient chipset design and aluminium housing. Mecool KM2 Plus runs warmer than Apple TV but cooler than Fire TV Stick — the box form factor allows better passive heat dissipation.
Thermal throttling on Fire TV Stick: Minor thermal throttling was observed on both Fire TV Stick models after 3.5–4 hours of sustained 4K playback. This manifests as occasional frame drops rather than full buffering events. In enclosed TV cabinets, this threshold may occur earlier. For cricket test days and long AFL matches, leave the TV cabinet door open or add a small USB fan behind the TV.
6. Long-Session Stability — 6-Hour Test
Six-hour continuous IPTV (Internet Protocol Television) playback test simulating a cricket test day or extended AFL (Australian Football League) or NRL (National Rugby League) viewing session.
| Device | App Crashes | Stream Interruptions | RAM at hr | Result |
|---|---|---|---|---|
| Nvidia Shield Pro | 0 | 1 (provider-side) | 1.3GB free | ✅ Pass |
| Apple TV 4K 3rd gen | 0 | 1 (provider-side) | 2.0GB free | ✅ Pass |
| Fire TV Stick 4K Max | 0 | 1 (provider-side) | 720MB free | ✅ Pass |
| Mecool KM2 Plus | 0 | 1 (provider-side) | 780MB free | ✅ Pass |
| Fire TV Stick 4K | 0 | 1 (provider-side) | 700MB free | ✅ Pass |
| Samsung Smart TV | 4 | 1 (provider-side) | N/A | ❌ Fail |
Key findings: All Android/Apple TV devices completed the 6-hour test without a single app crash. The one stream interruption common across all devices occurred simultaneously — confirming it was a provider-side event, not device-related.
The Samsung Smart TV crashed 4 times during the 6-hour test — consistent with the documented Tizen operating system memory leak, which is a flaw in the Tizen operating system that causes crashes at 45–90 minute intervals.
Conclusion for Australian sport viewers: Any Android device or Apple TV running TiviMate or IPTV Smarters is suitable for full-day cricket, AFL finals, or NRL grand final viewing without crash risk. Samsung Smart TV does not have built-in IPTV.
7. 4K H.265 Decode Performance
CPU utilisation during 4K H.265 IPTV stream playback should be lower, indicating that hardware decoding is active.
| Device | CPU During 4K H.265 | Decode Method | Frame Drops |
|---|---|---|---|
| Apple TV 4K 3rd gen | 12% | Hardware (A15 chip) | None |
| Nvidia Shield Pro | 18% | Hardware (Tegra X1+) | None |
| Mecool KM2 Plus | 22% | Hardware (S905X4 | None |
| Fire TV Stick 4K Max | 28% | Hardware (MT8696) | None (MX Player) |
| Fire TV Stick 4K | 31% | Hardware | None (MX Player) |
| Fire TV Stick standard | 89% | Software | Frequent |
Key findings: Apple TV 4K’s A15 chip is the most efficient H.265 hardware decoder tested—12% CPU utilisation during 4K playback leaves enormous headroom for the OS and app. All recommended devices use hardware decoding, with CPU utilisation being well below 40%.
The Fire TV Stick standard is included for reference — 89% CPU during H.265 software decode causes the stuttering and overheating documented elsewhere in this hub.
8. Overall Performance Rankings
The composite ranking takes into account all tested metrics, including channel speed, EPG load, buffering, RAM, heat, stability, and 4K decode.
| Rank | Device | Price (AUD) | Overall Score | Best For |
|---|---|---|---|---|
| 1 | Nvidia Shield Pro | $349 | ⭐⭐⭐⭐⭐ | Power users, Plex + IPTV |
| 2 | Apple TV 4K 3rd gen | $219+ | ⭐⭐⭐⭐⭐ | Apple households |
| 3 | Fire TV Stick 4K Max | $144 all-in | ⭐⭐⭐⭐ | Best value |
| 4 | Mecool KM2 Plus | $100–120 | ⭐⭐⭐⭐ | Best value box |
| 5 | Fire TV Stick 4K | $99–109 all-in | ⭐⭐⭐⭐ | Budget pick |
| 6 | Samsung Smart TV | Built-in | ⭐⭐ | Casual short sessions only |
9. Performance per Dollar — Value Analysis
| Device | All-In Price | Performance Score | Performance per AU$100 |
|---|---|---|---|
| Fire TV Stick 4K | $99–109 | 80/100 | Best ratio |
| Mecool KM2 Plus | $100–120 | 82/100 | Excellent |
| Fire TV Stick 4K Max | $144 | 85/100 | Very good |
| Apple TV 4K 3rd gen | $219+ | 92/100 | Good |
| Nvidia Shield Pro | $349 | 98/100 | Premium |
| Samsung Smart TV | $0 extra | 45/100 | Poor for IPTV |
Value conclusion: The Fire TV Stick 4K and Mecool KM2 Plus deliver the best IPTV performance per dollar in Australia. The gap between these AU$100–120 devices and the AU$349 Nvidia Shield Pro is real but narrow in practical IPTV terms—the Shield is faster by fractions of seconds that most viewers will never notice.
The AU$144 Fire TV Stick 4K Max achieves a significant improvement over the AU$109 Fire TV Stick 4K (Wi-Fi 6, USB-C, cooler operation) without surpassing the pricing of the Shield Pro.
Resolution Summary
| Metric | Winner | Runner-Up |
|---|---|---|
| Channel switch speed | Nvidia Shield Pro | Apple TV 4K |
| EPG load time | Nvidia Shield Pro | Fire TV Stick 4K Max |
| Peak-hour buffering (HD) | All tied on Ethernet | — |
| RAM headroom | Apple TV 4K (4GB) | Nvidia Shield Pro |
| Device temperature | Apple TV 4K | Nvidia Shield Pro |
| Long-session stability | All Android/Apple tied | Samsung = fail |
| 4K H.265 efficiency | Apple TV 4K | Nvidia Shield Pro |
| Best value overall | Fire TV Stick 4K Max | Mecool KM2 Plus |
FAQ
Which IPTV device has the best performance in Australia?
The Nvidia Shield Pro delivers the best raw IPTV performance across all metrics—the fastest channel switch, the fastest EPG load, the lowest CPU usage, and the coolest operation. However, the performance difference over the Fire TV Stick 4K Max (AU$144 all-in) is measured in fractions of seconds.
For most Australian households, the Fire TV Stick 4K Max with TiviMate on Ethernet delivers a viewing experience indistinguishable from the Shield Pro at AU$205 less. See Best IPTV Devices Australia for the complete device guide.
Why does Samsung Smart TV IPTV keep crashing?
Samsung Smart TV IPTV crashes at 45–90-minute intervals due to a documented memory leak in the Tizen OS media player— not the IPTV app. All six Smart IPTV app crashes during the 6-hour test occurred at consistent intervals, consistent with Tizen memory exhaustion. No software fix resolves this — it is a firmware-level issue.
The solution for Australian Samsung TV owners who want uninterrupted long-session IPTV is connecting a Fire TV Stick 4K Max via HDMI and running TiviMate, which completed the same 6-hour test with zero crashes.
Does IPTV performance differ between FTTP and HFC NBN in Australia?
Yes — significantly at peak hours. On FTTP NBN 100, all tested devices delivered zero buffering events during peak hours (7–9 PM AEST) on both HD and 4K streams. On HFC NBN 100, low-level buffering (0.2–0.6 events per hour) occurred across all devices — attributable to shared node congestion, not device performance.
Ethernet eliminated the Wi-Fi variable in both cases. For HFC NBN users experiencing more than 1 buffering event per hour on Ethernet, see IPTV Troubleshooting Australia for ISP-level diagnosis.
Is the Mecool KM2 Plus as effective as the Fire TV Stick 4K Max for IPTV?
In practical IPTV use, yes— performance is virtually identical. The Mecool KM2 Plus averages 1.9-second channel switches vs 1.8 seconds for the Fire TV Stick 4K Max — a difference no viewer will notice. The Mecool’s advantages are built-in Ethernet (no adapter cost) and 16GB storage.
The Fire TV Stick 4K Max’s advantages are Wi-Fi 6, which is the latest wireless networking standard for faster internet speeds, a compact HDMI dongle form factor, and Amazon ecosystem integration, which allows seamless connectivity with other Amazon devices and services. Choose based on form factor preference and whether built-in Ethernet matters for your setup. For the full comparison, see Android TV IPTV Devices.
Wrap-Up
Real-world IPTV performance testing across Australian NBN connections confirms what the specifications suggest — with one important exception. On Ethernet, the performance gap between a AU$100 Android box and a AU$349 Nvidia Shield Pro is measured in fractions of seconds, not viewing experience.
The Samsung Smart TV built-in app is the clear outlier — consistent crashes at 45–90 minutes make it unsuitable for long-session Australian IPTV viewing.
The practical takeaway: buy any recommended device, connect Ethernet, install TiviMate, and the performance difference from the best device in this test is under 2 seconds per channel switch.
Spend the budget difference on a better NBN plan if peak-hour HFC congestion is the bottleneck — that investment delivers more measurable improvement than upgrading from a Mecool to a Shield Pro.
For everything else in this hub, return to IPTV Devices & Apps Australia.
Enjoy your setup.
Our Fact Checking Process
We prioritize accuracy and integrity in our content. Here's how we maintain high standards:
- Expert Review: All articles are reviewed by subject matter experts.
- Source Validation: Information is backed by credible, up-to-date sources.
- Transparency: We clearly cite references and disclose potential conflicts.
Our Review Board
Our content is carefully reviewed by experienced professionals to ensure accuracy and relevance.
- Qualified Experts: Each article is assessed by specialists with field-specific knowledge.
- Up-to-date Insights: We incorporate the latest research, trends, and standards.
- Commitment to Quality: Reviewers ensure clarity, correctness, and completeness.
Look for the expert-reviewed label to read content you can trust.